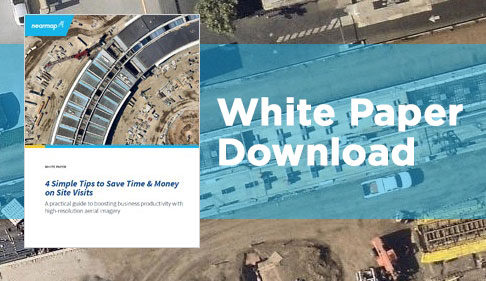
White Paper: 4 Simple Tips to Save Time & Money on Site Visits

Professionals in architecture, construction, and engineering rely on accurate and up-to-date data to effectively design, plan, construct, and maintain buildings and sites and often have to do site visits.
They need more than just numbers and measurements. They need to be able to see the environment, what’s on the ground now, and how it has changed over time. Yet, despite dramatic advances in technology in recent years, many of these businesses still rely on highly manual approaches to collect, update, and report on terrain and site information.
These methods usually require sending workers, vehicles, and equipment on-site multiple times throughout the lifespan of a project. Due to the high level of human interaction involved, not only do these methods introduce manual error and unnecessary risk—they require substantial investment of time and resources.
The US Department of Labor estimates the average annual salary of a construction site worker to be $36,550 with vehicle running costs of $0.54/mile:
- Assuming such a worker makes one site visit per day with an hour of travel time to the site, the business would have spent $12,344 in a year on site visits.
- The demand on time and resources is easy to see—and this example only represents a single worker. Imagine a crew of workers spending several hours each day.
Download this white paper to discover how these 4 simple tips can save you time and money on site visits.
1. Figures based on data sourced by the US Department of Labor at http://www.bls.gov/oes/current/oes472061.htm, May 2015, and US General Services Administration at http://www.gsa.gov/portal/content/100715, January 2016.
2. Calculation of figures based on: http://go.nearmap.com/savings-calculator, Nov. 2016


Comments
Leave a Reply
Have an account? Login to leave a comment!
Sign In