


Adhered Systems are Cost Competitive Once Long Term Energy Efficiency is Factored In

By Thomas J Taylor, GAF.
Recent research into the overall thermal impact of the fasteners that penetrate roofing insulation has found the effect to be significant.
A study shows that when the long term energy cost of thermal bridging due to mechanical fasteners is taken into account, adhered systems can be cost competitive. Adhesively bonded roofing assemblies can offer long term energy efficiency and improve the overall thermal performance of the building enclosure. This article uses a case study approach to show that adhered systems can be competitive with mechanically fastened assemblies.
Introduction
Thermal insulation in roofing systems plays a substantial role in the overall thermal performance of the building enclosure. Mechanical fasteners are commonly used to secure the insulation and roofing membrane to the structural roof deck. Each metal fastener creates a thermal bridge that reduces the effectiveness of the insulation. For a single fastener, the impact would probably be negligible. A typical roof, though, may include thousands of fasteners. The effect of these myriad thermal bridges adds up. That is, the combined impact of the fasteners substantially reduces thermal performance, as outlined in a previous blog by guest writer Eric K. Olson, P.E., of Simpson, Gumpertz and Heger.
In this article, a case study approach is used to compare total costs of mechanically fastened versus adhered systems. The total costs include the reduction in R-value that result from insulation and membrane metal fasteners.
Case Study
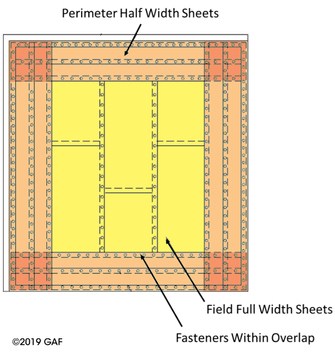
Description of Building —The building used for this study was single story big box type, less than 35 feet in height, with a roof area of 125,000 ft2 in a rectangular configuration of approximately 290 × 431 ft. The roof was assumed to be a new installation, i.e., new construction or a total roof replacement. The wind-uplift zones of the roof assembly are as shown below.

Roof Schematic Showing the Three Zones—Field, Perimeter, and Corner.
The mechanically attached systems used #12 fasteners and 3 in. diameter plates for both insulation and membrane attachment. It is recognized that #15 fasteners and smaller diameter plates are used for membranes, but the assumptions here kept the work consistent with previous studies and are not thought to make a significant difference.
Wind Uplift Requirement — Fastener patterns and densities were calculated based on a wind uplift requirement of 120 pounds per square foot, a 22 ga. metal deck, and a 60 mil single-ply thermoplastic membrane having a width of 10 feet.
Roof Membrane — The membrane was assumed to be TPO, with three-year aged reflectance of 68 and emittance of 83, these representing long-term roof performance. Reflectivity and emissivity data for most membranes can be found in the Cool Roof Rating Council’s directory.
Roof Assemblies — Three cases are considered, shown below:
| Case 1 |  |
| Insulation — R-30 total, mechanically attached in two layers; top 3 in. R-17.4 and bottom 2.2 in. R-12.6.
Membrane — mechanically attached. |
|
| Case 2 |  |
| Insulation — R-30 total, mechanically attached using induction welding plates installed as two layers; 3 in. R-17.4 and 2.2 in. R-12.6.
Membrane — attached via induction welding to insulation plates. |
|
| Case 3 |  |
| Insulation — R-30 total, top 3.8 in R-21.4, adhered to bottom layer of 1.5 in. R-8.6 mechanically attached.
Membrane — fully adhered. |
Membrane Attachment — For Case 1, the membrane was mechanically attached using fasteners installed 6 inch on center, as shown in here:
For Case 2, the plates were coated to enable induction welding of the membrane to the plates. For Case 3, the membrane was attached to the top layer of insulation using conventional adhesive designed for smooth, unbacked membranes.
Insulation Attachment — In Case 1, the insulation boards were attached using five fasteners through each of the topmost 4 × 8 ft. layer boards down through the steel deck. For Case 2, the insulation fastener density varied according to the roof wind-uplift zone.
For Case 3, the bottom insulation layer only was attached to the steel deck using five fasteners through each 4 x 8 ft. board. The second layer was adhered using conventional insulation adhesive.
The insulation fastener densities (i.e. use rates), per 4 × 8 ft. polyiso board, are summarized here:
| Assembly | Roof Zone, Fastener per 4 × 8 ft. Polyiso Board | ||
| Field | Perimeter | Corner | |
| Case 1 | 5 | 5 | 5 |
| Case 2 | 8 | 15 | 20 |
| Case 3 | 8 | 12 | 16 |
Total Fastener Densities —Taking into account both membrane and insulation fasteners, the overall roof fastener densities were calculated to be:Design Insulation Value — The systems were all intended to be an R-30 design. Insulation thicknesses were calculated using labeled R-values which are a 15 year time weighted average.
Effective R-Value — The fasteners used to attach insulation boards and single-ply membranes act as thermal bridges, so that the design R-value is reduced to an effective R-value. Olson has calculated the percent reduction from design R-value to be up to 29-percent.
Using the fastener densities shown earlier, together with the relationship between fastener density and percent reduction in R-value, the effective R-values are as shown as:
Cost of Lost R-Value Due to Thermal Bridging — The reduction from designed R-value caused by thermal bridging has an immediate cost, i.e., the economic value of the “lost” insulation. This was calculated in terms of US dollars per R-value lost, i.e., purchased material that did not contribute to insulation. For polyiso, a material-based cost to the building owner of $0.10 per sq.ft per R-1 was assumed (this being a non-negotiated list price).The effective R-values for each assembly and roof size are significantly lower than the design R-30 in most cases, which questions the assumption that roofing insulation is effectively continuous.
The economic cost of reduction from design to effective insulation value for each assembly, in terms of the cost of an equivalent thickness of polyiso was calculated to be:
| # Fasteners/sq.ft. | Sq.ft. per fastener | |
| Case 1 | 0.4166 | 2.4 |
| Case 2 | 0.2751 | 3.6 |
| Case 3 | 0.2644 | 3.8 |
The lowest cost and most effective assembly in terms of R-value is Case 3, the adhered system.The insulation cost in lost R-value for a fully mechanically attached system is $56,079 for this 125,000 sq.ft. big box-type building, as indicated for Case 1, the mechanically attached system. This is a significant loss in economic value.
Cost of Fasteners — The fastener material cost is shown next, and takes into account fastener length (shorter being lower cost), higher cost fastener plate for inductive attachment for Case 2, as well as fastener densities for each assembly. Labor costs are not included.
| Cost of Fasteners | |
| Case 1 | $13,892 |
| Case 2 | $19,099 |
| Case 3 | $3,900 |
Low-rise foam adhesive for adhering the upper layer of polyiso to the bottom layer. The cost of the adhesive was assumed to be $0.20 per square foot of roof assembly.Cost of Adhesive — For Case 3, there is the added cost of adhesive. For the purposes of this analysis, two types of adhesive attachment were considered:
- A solvent-based adhesive for attaching the membrane to the substrate. This was assumed to cost $0.28 per square foot of roof assembly.
Thus, the total adhesive cost in Case 3 was $60,000 for this 125,000 sq.ft. building. Note that this a materials only value.
Building Location and Energy Costs — Six potential locations were considered for the building. These and the associated energy costs for gas heating and electric air conditioning are shown below. The gas and electric costs were obtained from the US Energy Information Administration and averaged over 2016. Demand charges were obtained for each city’s utility and based on medium-size commercial customer’s tariffs, from a Utility Rate Database. In cases where multi-tiered demand charges were cited, these were averaged across the applicable months.
Energy-cost data for commercial customers, averaged for 2016.
| City, State | Electric Cost, $/kWhr | Demand Charge, $/kW | Gas Cost, $/1,000 cu ft. | Gas Cost, $/Therm |
| Miami, FL | 0.0911 | 9.2 | 10.42 | 1.042 |
| Houston, TX | 0.0771 | 5.477 | 6.89 | 0.689 |
| Fresno, CA | 0.1515 | 13.32 | 8.42 | 0.842 |
| Nashville, TN | 0.1003 | 9.67 | 7.8 | 0.78 |
| Albany, NY | 0.1447 | 10.27 | 6.18 | 0.618 |
| Minneapolis, MN | 0.0988 | 12.32 | 6.44 | 0.644 |
Results: Total Material Costs for Each CaseEnergy Modeling — The Oak Ridge National Labs CoolCalcPeak calculator was used to compare energy costs for each Case relative to the design R-30 value. The building air-conditioning coefficient of performance was set as 2.5 and the natural gas heating efficiency was set as 0.8. Both are high-efficiency values and would be more typical of today’s heating and air-conditioning systems installed in new construction.
The total costs involved in deviating from the design R-30, due to lost R-value caused by thermal bridging, and fastener and adhesive cost for each case are shown in this chart:
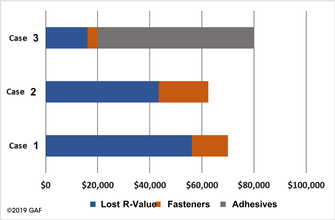
The costs associated with deviating from a design R 30, due to lost R-value and fastener and adhesive costs for the 125,000 square foot building. Case 1 is mechanically attached, Case 2 is induction welded, and Case 3 is adhered.
This data challenges industry assumptions about costs. By including the cost of lost R-value due to thermal bridging, the high cost of adhesives is balanced by the adhered system being closest to the design R-value.
Results: Loss of Energy Efficiency Due to Fasteners —The effective R-values for each Case were used to calculate the cost of a building’s reduced energy efficiency relative to the design R 30 over a 15-year time frame. The latter was chosen based on the published R-values representing the time weighted 15-year thermal resistance. Given that reflective membranes lose some of their reflectivity over time, the three-year aged membrane data were used. The cost of reduced energy efficiency is shown as:
| City, State | Case 1 | Case 2 | Case 3 |
| Miami, FL | $18,750 | $15,000 | $7,500 |
| Houston, TX | $11,250 | $9,375 | $5,625 |
| Fresno, CA | $22,500 | $18,750 | $9,375 |
| Nashville, TN | $13,125 | $11,250 | $5,625 |
| Albany, NY | $11,250 | $9,375 | $5,625 |
| Minneapolis, MN | $11,250 | $9,375 | $3,750 |
Conclusions for the cities examined in this study, Fresno had the highest energy costs and Houston, Albany, and Minneapolis all had the lowest costs.
Taking the highest energy cost location first, and adding the 15 year loss in energy efficiency to the costs of materials, shows the following comparison:
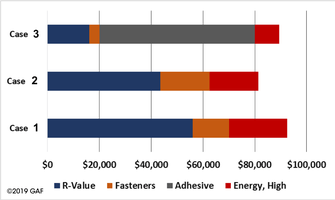
Doing the same for the lowest energy cost cities shows:

- In each Case, once the effect of thermal bridging is factored in along with associated energy costs due to the lowered effective R-value, the mechanically attached system cannot be regarded as the clear winner in terms of cost.
- The inductively welded system appears to be the lowest cost approach overall, although the effective R-value is reduced almost as much as the traditional mechanically attached system. This would have negative implications for any future energy cost increases and from an energy use perspective is not as favored as the adhered system.
- Adhered systems have traditionally been regarded as being the highest cost approach for roof assembly attachment. However, the case study here suggests that this is only the case if the effects of thermal bridging and loss of energy efficiency are ignored. Once these are factored in, adhered systems are actually competitive.
- Adhered systems do not flutter or billow during high wind events, thereby eliminating the drawing up of interior conditioned air up into the roof assembly (e.g., infiltration). This latter phenomenon would naturally further reduce energy efficiency and make the long term cost of mechanically attached systems even higher.
- For areas of the country that require high wind uplift strengths and therefore adhered systems are frequently used, this study shows that they don’t carry a cost penalty once the effect of minimizing thermal bridging is factored in.
This case study shows that it is important to take into consideration the long-term performance of roof systems and that considering only initial costs does not tell the complete story.
It should be noted that the analysis shown here was based on material costs and did not take into account the cost of installation. Labor rates vary significantly by location and would need to be taken into account during any validation work.
Learn more about GAF.
Original article source: GAF
Recommended For You

Employee leasing arrangements may have unexpected consequences
Read More ...
23 Marketing Mistakes Roofers Make – Mistake # 23 Not Using Education to Sell your Roofing Services
Read More ...
Metal versus Concrete
Read More ...


Comments
Leave a Reply
Have an account? Login to leave a comment!
Sign In